

Key insights: LED Solar Simulators, Sun Calculations
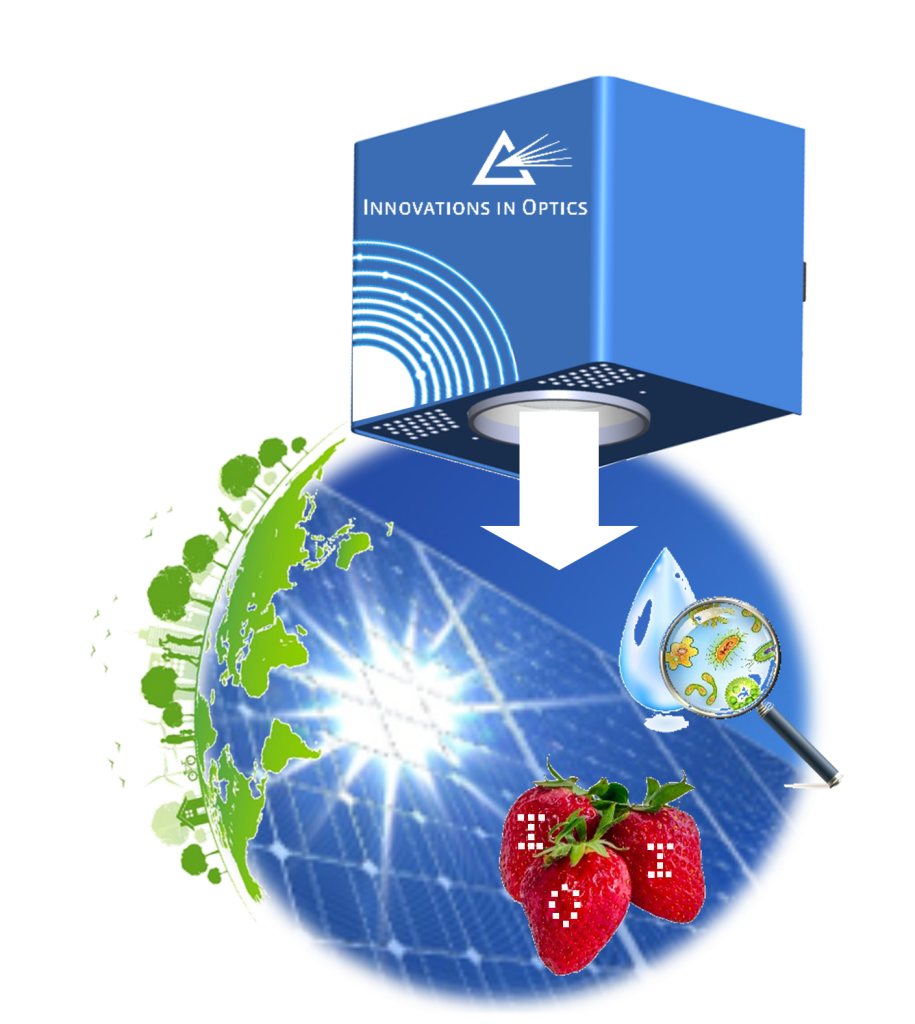
Engineered sunlight is a vital tool within research, development, and manufacturing realms for numerous applications. LED Solar Simulators, like LumiSun-50TM and the forthcoming large area LumiSun-220TM, are environmentally friendly, long-lived, and cost-effective. For highly accurate measurements in PV testing and research, materials testing, photochemistry and biology, Class A+A+A+ LED solar simulators with individually controlled wavelengths are of great value. From the sweet red strawberries you eat, to the sunscreen, pure water, wearables, and solar panels powering a cleaner world, engineered sunlight plays an important role.
Optical Output LED-Style
LED solar simulators often provide a superior alternative to arc lamps. The keys to their success include selecting the appropriate quantity and spectrum of LED die, maximizing LED die output and lifetime, capturing and delivering photons, and ensuring stability and uniformity. The elite systems reflect decades of experience with LED technology and include proprietary thermal management, optical, and electrical designs.
To review, Class A+A+A+ solar simulators, such as the LumiSunTM series, and Class AAA have the following definitions for spectral match, non-uniformity of irradiance, and temporal instability:1
| Classification per IEC | Minimum λ Range for Evaluation (nm) | Spectral Match to all Intervals (%) | Spatial Non-Uniformity of Irradiance (%) | Temporal Instability (%) | |
| Short Term (STI) % | Long Term (LTI) % | ||||
| A+ | 300 – 1200 | 87.5 to 112.5 | 1 | 0.25 | 1 |
| A | 400 – 1100 | 75 to 125 | 2 | 0.5 | 2 |
Table 1: Definition of Class A+A+A+ and Class AAA solar simulators per IEC 60904-9 Edition 3.0 2020-09.
In addition, Spectral Coverage (SPC) and Spectral Deviation (SPD) are important measures beyond Class, and they are defined by the IEC as:2

(1)

(2)
To provide high accuracy in testing and research, users should select Class A+A+A+ with high SPC and low SPD, and with individual control of each wavelength to enable custom spectra.
How does this translate to real-world scenarios?
Our earth is comprised of multiple elevations, atmospheric conditions, longitudes. and latitudes that experience different types of sunshine. Thus, there are definitions that account for the sun’s position and atmospheric effects. These aid in the comparison of PV modules, optical materials, and solar simulators. They do not account for local weather variability, sun angle variation (am vs. pm), or geographic extremes (poles, equator).
For example, the “1 Sun” definition under AM1.5 Global (ASTM G-173-03) is a standardized reference for solar irradiance. It defines the solar power per unit area that reaches a flat, sun-facing surface on the Earth under typical clear-sky conditions at a solar zenith angle of 48.2˚. Note – Air Mass (AM) is the relative optical path length that sunlight travels through the Earth’s atmosphere compared to when the sun is directly overhead (zenith AM1.0). As air mass increases, sunlight must pass through more atmosphere which causes an increase in scattering (blue scatters more so sunlight appears redder), and an increase in absorption (by O2, O3, H2O, CO2 which reduces intensity, especially in UV and IR).
The total integrated spectral irradiance from 280nm to 4000nm at 1 Sun (AM1.5G) is 1000.4 W/m2 (or 100.04 mW/cm2). Above 4000nm, the solar power drops off rapidly and contributes minimal additional irradiance. The visible range (400 – 700nm) accounts for almost 45% of the total irradiance. The most energy, 47.7%, is in the NIR region (700 – 2500nm), and the UV portion, though small at 4.9%, is critical for assessing material or solar panel degradation. See Table 2 below.
| Spectral Band | λ range (nm) | Irradiance (W/m2) | % of Total |
| UV | 280 – 400 | 49.4 | 4.9 |
| Visible | 400 – 700 | 445.0 | 44.6 |
| NIR | 700 – 2500 | 477.3 | 47.7 |
| IR | 2500 – 4000 | 27.8 | 2.8 |
| TOTAL | 280 – 4000 | 1000.4 | 100 |
Table 2: Contributions of spectral regions to total irradiance for 1 Sun (AM1.5G) from ASTM G-173-03
A high-class solar simulator coupled with these definitions enable repeatable lab testing of solar-related devices without requiring natural sunlight.
How does this differ for AM0?
AM0 spectra comprises the solar irradiance outside the Earth’s atmosphere which differs significantly from AM1.5G and is used typically for extraterrestrial applications (e.g. space, satellite conditions). There is higher UV content, but no atmospheric absorption bands from H2O (940nm, 1130nm, 1400nm, 1900nm), CO2 (1600nm, 2000nm), or O2 (760nm). The total irradiance is higher for AM0 since, for AM1.5G, the atmospheric attenuation reduces it by approximately 27%. Figure 1 shows the comparison in spectra for AM1.5G vs. AM0.
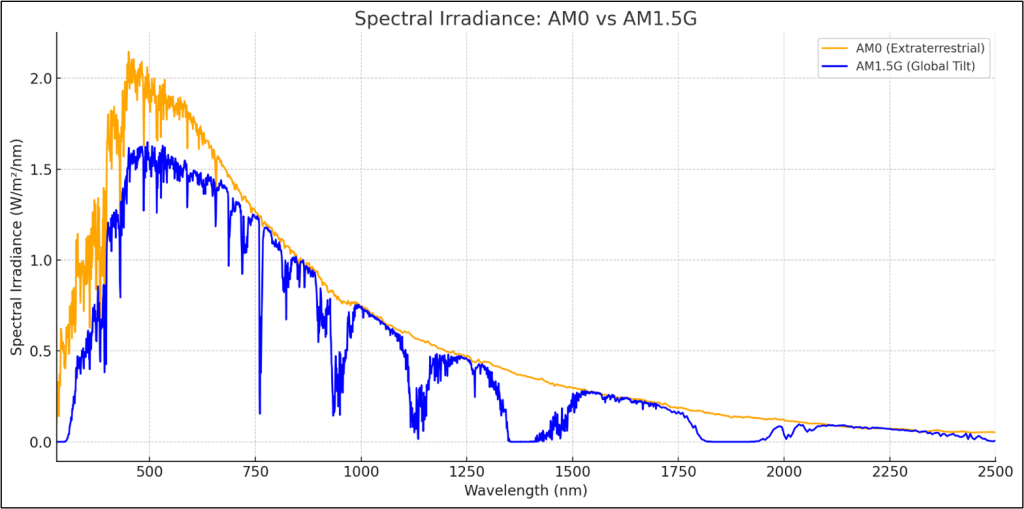
Figure 1: Spectral irradiance comparison (ASTM data) for AM0 vs. AM1.5G shows the attenuation effect of Earth’s atmosphere on solar energy. Note higher irradiance for AM0 and no absorption bands.
What irradiance values should I expect for my solar simulator?
Solar simulators base their irradiance values on 1 Sun which extends over the wavelength range of 280 to 4000nm. The total integrated spectral irradiance for AM1.5G is approximately 1000.4 W/m2 and for AM0 it is higher at 1366.1 W/m2. There is little contribution to the solar spectrum above 2500nm, but it is factored into the total. For a solar simulator that has output between 350nm and 1250nm, like LumiSun-50TM, the integrated irradiance is 845.4 W/m2 which, expectedly, is a portion of the 1 Sun 1000.4 W/m2. Referring to Figure 2, the spectrum highlighted above 1250nm is not included in the LumiSun though the definition of 1 Sun extends to 4000nm.
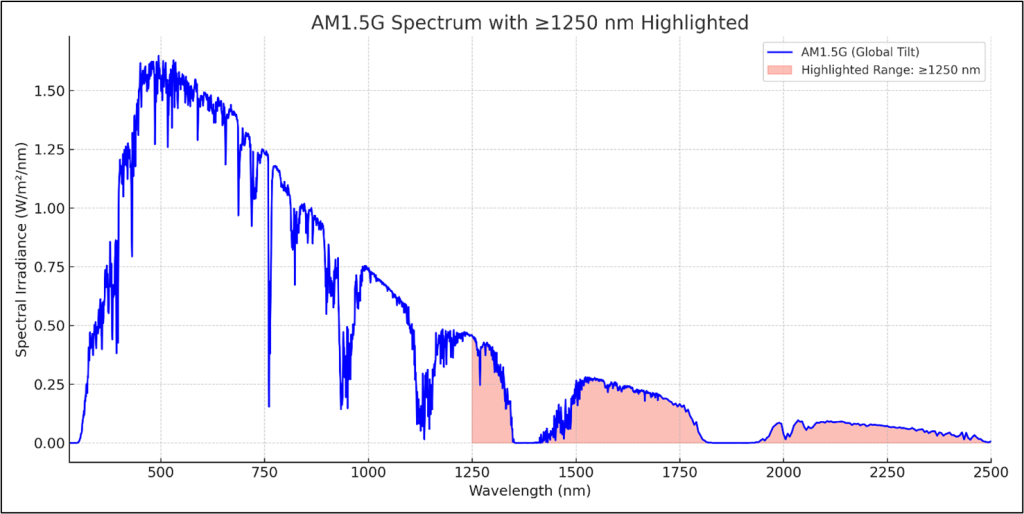
Figure 2: Reference solar spectrum for AM1.5G with wavelengths > 1250nm not included in solar simulator. Total integrated irradiance up to 1250nm is less than 1 Sun.
In fact, any band-limited subset of the spectrum will yield a proportionally lower total integrated irradiance. For example, Figure 3 shows that the integrated irradiance from 400nm to 1100nm in the AM1.5G spectrum is 758.7 W/m2. This range corresponds to the primary active region for standard silicon-based solar cells.
While the spectral intensity at a given wavelength may match that of the sun, the total integrated irradiance will be less than 1 Sun if the solar simulator spans only a portion of the full AM1.5G spectrum, defined from 280nm to 4000nm. Therefore, even when calibrated to 1 Sun, a simulator with a narrower spectral range will (and should) deliver less than the full 1000 W/m² of integrated irradiance.
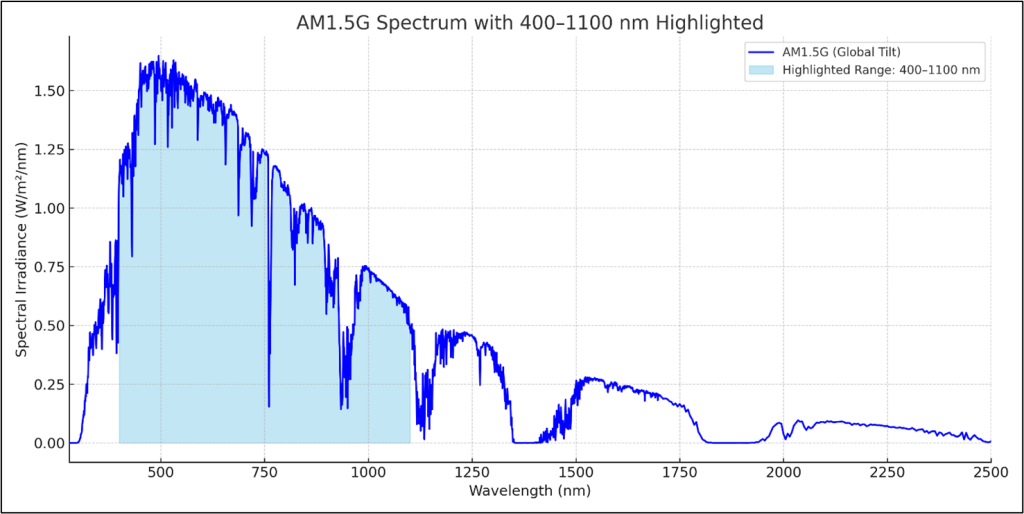
Figure 3: Total integrated irradiance = 758.7 W/m2 for 400nm to 1100nm AM1.5G
In addition, LED solar simulators capable of customizable spectrum and individual wavelength control, like LumiSun-50TM, offer substantial flexibility. It is important to understand, however, what the reported values mean and how to adjust each wavelength. When one wavelength is set by the user to the corresponding 1 Sun value (i.e. 100%), the peak intensity may report lower than what is expected for 1 Sun. This is the nature of LED solar simulators. Each LED has a specific spectral bandwidth, and the 1 Sun solar spectrum is generated by combining the outputs of numerous LEDs, many of which have overlapping wavelength ranges. As a result, the intensity representative of 1 Sun illumination is typically the combined contribution of multiple LED peak wavelengths.
For example, in Figure 4 below, the 640nm LED die spectrum overlaps with the broad white die spectrum, as well as the 620nm and 660nm LEDs, which have approximately 14nm FWHM. Thus, the irradiance at any one of those LED die channels is less than its total in the solar simulated spectrum. The best LED solar simulators are designed with this overlap in mind and with high numbers of LED die to give excellent spectral match and low spectral deviation.
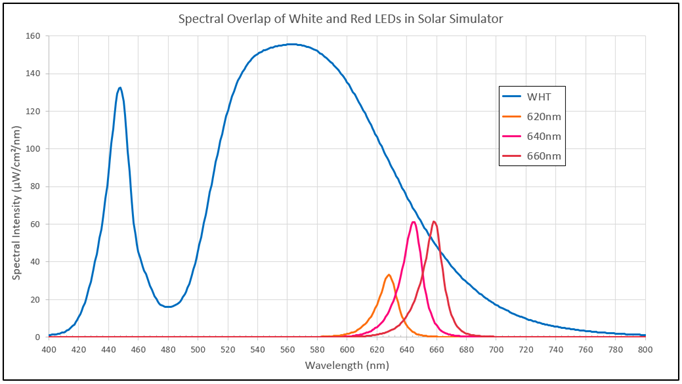
Figure 4: Overlapped spectrum of 4 LED die that contribute to one peak wavelength in a solar simulator
Conclusion
Offering a harvest of benefits – tunable spectral output, high stability, and long operational life – LED solar simulators cultivate controlled environments that empower discovery and precision. Understanding the nuances of their operation and what the engineered sun represents equips users to seed solutions across a broad spectrum of industries.
Engineered sunlight is ripe with capability – ready to energize innovation wherever it shines.
NOTES/REFERENCES
1 IEC 60904-9 Edition 3.0 2020-09 Photovoltaic devices – Part 9: Classification of solar simulator characteristics. Pages 9 – 12
2 IEC 60904-9 Edition 3.0 2020-09 Photovoltaic devices – Part 9: Classification of solar simulator characteristics. Pages 11 – 13